This web page was produced as an assignment for an undergraduate course at Davidson College.
The researchers in this paper were attempting to engineer a genetically encoded logic gate system that accomplished three main goals. They wanted to make a design that could reuse the same regulatory molecules to implement the logic gates in a single logic layer, rather than other systems that use non-reusable regulatory molecules, leading to problems in scalability. They also wanted to decouple the signals that control the switch from inputs to outputs. Finally, they wanted all the gate signals in their design to be encoded by a common signal carrier, thereby supporting integration with natural systems and with a wide array of synthetic genetic devices. Together, these goals would allow for simple, versatile engineering of logic gates with highly tunable inputs and outputs. They designed a three-terminal device called the transcriptor, which used bacteriophage serine integrases to control the flow of RNA polymerases along the DNA and implement various logic gates.
The researchers succeeded in building XOR, OR, NOR, XNOR, AND, and NAND logic gates using their device architecture. They quantified the digitization of their gates by establishing the control signal threshold for low/high output signals, as well as the “digitization error rate” to measure the probability of their gates showing a false high or low output signal in response to intermediate concentrations of their control signal. Finally, they showed that their gates function as amplifiers, a commonly desired trait in synthetic genetic logic gates.
I thought the transcriptor design for implementing logic gates was a very clever and useful system. I thought their testing of their gates (mostly the digitization and amplification testing) got a little overly complicated at times, but I think that this was more a function of their having to condense their data so much since it is a Science paper. I would love to see some experiments done with making multiple logic layers using this system and see how it works.
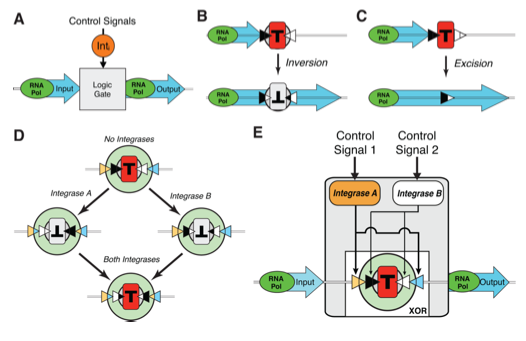
This figure serves to illustrate the general design of the three-terminal “transcriptor” design. Panel A is the most general representation, showing how the design is using an integrase control signal to perform logic on an RNA polymerase flow input, leading to an output of RNA polymerase flow. Panels B and C show two ways in which an integrase can be used to manipulate DNA in order to perform logic. They can either invert a terminator sequence (T) using recombination sites that flank the terminator (black and white triangles), or the integrase can excise DNA (here, specifically, a terminator) between two recombination sites. Both inverting and excising the terminator sequence would allow a positive output, as the RNA polymerase would not hit the terminator sequence and fall off the DNA strand, but rather continue to flow along it. Panel D shows an XOR logic element that the researchers designed by flanking a terminator by two pairs of recombination sites, each of which is recognized by an independent integrase. This means that if no integrase is present, the terminator sequence is in its functional orientation and blocks transcription. But if one or the other integrase is present, the terminator is flipped and it does not block transcription. But if both integrases are present, the terminator is effectively flipped twice, thereby placing it in its functional orientation again and blocking transcription. Finally, panel E shows the logic design from panel D in a three-terminal Boolean integrase XOR gate system, in which control signal 1 and 2 control the expression of integrase A and B respectively. These integrases can then invert the terminator using the recombination sites. So the gate output is high only if the control signals are different, as this leads to the integrase signals being different, leading to high gate output.
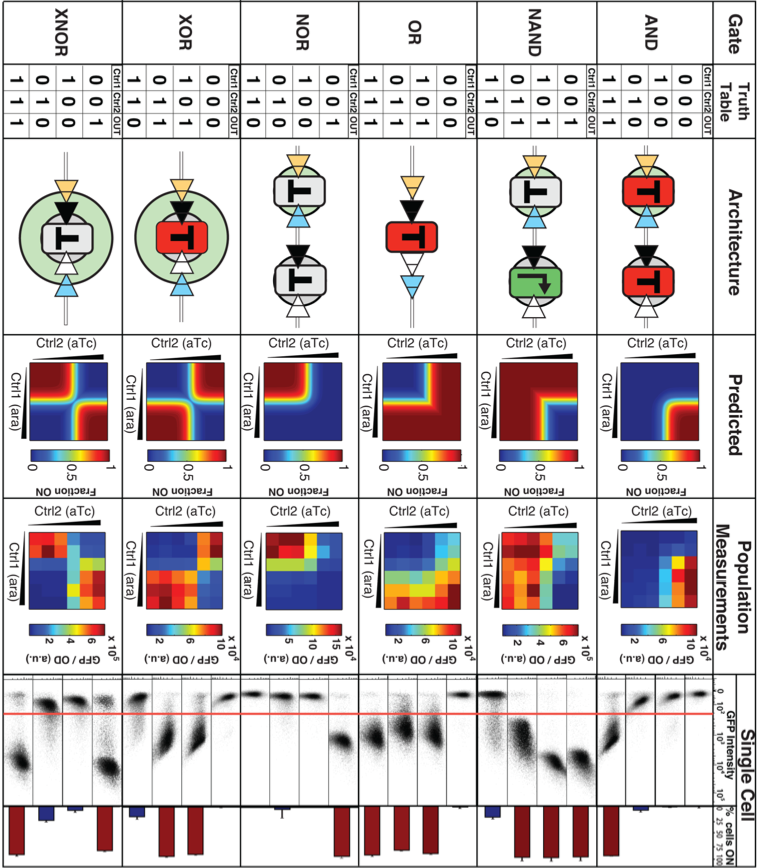
This figure shows the researcher’s designs for each logic gate. The Truth Table row shows the truth tables for each logic gate, with a 1 representing a high gate output, and a 0 representing a low gate output. The architecture row shows the design of each type of logic gate. The triangles represent recombination sites, the red Ts represent terminators in a functional position, the grey Ts represent terminators in a non-functional position, and the black arrow in the green box for the NAND gate represents a constitutive promoter. The predicted row shows the predicted levels of gate output for each gate at different concentrations of control signals. The more red the color, the higher the output, and blue correlates to lower output. Ten the Population Measurements section shows the experimental results for each logic gate when they implemented them in cells (assayed via plate reader). Color scheme is the same as the above row. In the single cell row, the results for single cells are plotted together on two different types of graphs. The GFP intensity section plots the GFP intensity of cellular outputs on the x-axis, and the number of cells on the y-axis, and the horizontal red line across the graphs shows the common output threshold segregating low and high outputs across every gate. In the % cells ON section, the bars correlate to the fraction of cells expressing a high output. In both of these two sections, the higher bars or groups of data points below the red line correspond the expected output levels for the control inputs (column inputs are lined up with the truth tables), and in the Population measurements section the experimental results closely mirror the predicted heat maps, meaning that their logic gates function as expected.
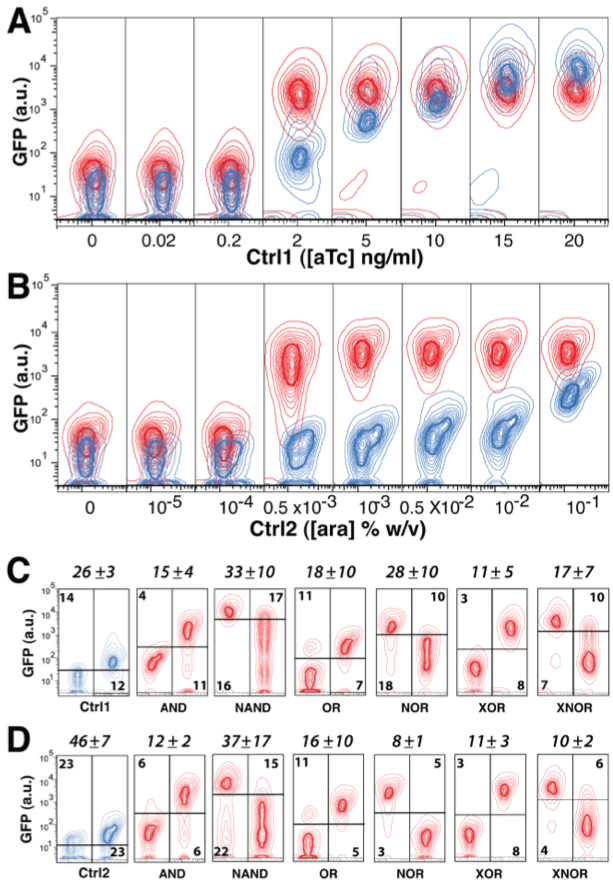
In this figure, the researchers investigated the digitization of their gates and tried to identify a threshold control input concentration to induce a low or high output signal in each gate construct. Panels A and B show that while the control signals (blue contours) increase gradually, in the XOR gate the output (red contours) switches from low to high between 0.2 and 2 ng/ml aTc and 0.0001-0.001% arabinose (the two control signals). This can be seen by the sudden separation of the blue and red contours at these concentrations of control signal. Panels C and D show the digitization threshold and “digitization error rate” for each gate. The horizontal bars represent the threshold for digitization for each gate (the threshold at which the gate changes from a low output to a high output). The numbers in the frames represent the high-given-low and low-given-high error rates, and the numbers above the boxes are the digitization error rates for each gate, which is defined as “the combined probability of scoring false high or low gate outputs in response to intermediate control signals” (Bonnet et al.). So based on these data, the NOR gate is the most digital of the gates, whereas the NAND gate has the noisiest output. In all of these figures, each contour line encompasses 5% of all cells.
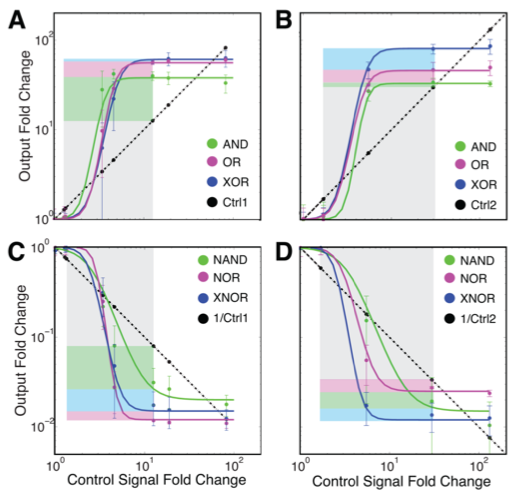
This final figure shows the amplification and fold-change capabilities of the different gates. The figures compare the changes in gate outputs (colored lines) to the changes in the control signals needed for gate switching (straight dashed lines). The response of each control signal to itself (gray boxes) and the gate-specific amplification of each control signal (colored boxes) are also shown, to highlight that the response of the control signals to themselves are larger than their gate specific amplification. The x-axes for the graphs are the fold change in the control signals, and the y-axes are the fold change in the outputs. Panel A shows the increasing expression of one of the integrases as mediated by the first control signal, and panel B shows the increasing expression of the other integrase as mediated by the other control signal. Panels C and D show the fold changes in output signals for inverted amplifier gates. In Panels A and B, the gates show that they amplify the output signal because the colored lines have a higher output fold change than the straight dashed line (as indicated by their being higher than the straight dashed line), indicating a higher fold change, or an amplification. The inverse is seen in panels C and D because they are showing data for inverting amplifier gates, so the colored lines are below the straight dashed lines, indicating inverted amplification.
Works Cited
Bonnet, Jerome, Peter Yin, Monica E. Ortiz, Pakpoom Subsoontorn, and Drew Endy. "Amplifying Genetic Logic Gates." ScienceXpress (2013): 1-7. 28 Mar. 2013. Web. 3 Apr. 2013.
Genomics Page
Biology Home Page
Email Questions or Comments to beclarkson@davidson.edu.
© Copyright 2013 Department of Biology, Davidson College, Davidson, NC 28035